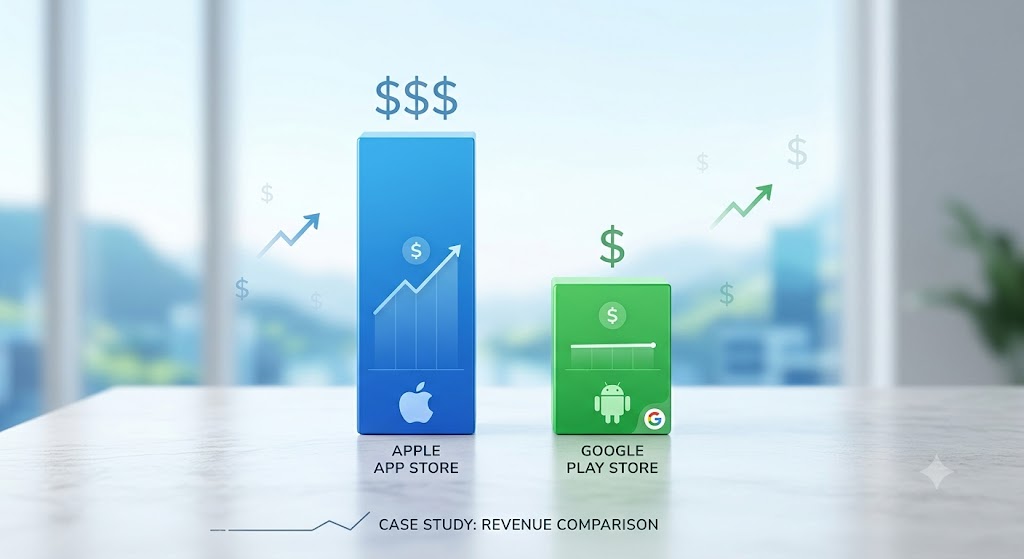

Despite Android dominating global smartphone market share (roughly 70% globally), Apple’s App Store consistently captures nearly 60–65% of global app consumer spending. According to industry data, the Apple App Store generated approximately $117 billion compared to Google Play’s $49 billion in consumer spending.
Bigabid+ 1
This case study analyzes the underlying demographic, economic, structural, and behavioral factors driving this revenue disparity for mobile software developers.
1. Key Drivers of Revenue Disparity
A. Demographic & Income Profile (Purchasing Power)
- Higher ARPU (Average Revenue Per User): Apple devices carry a premium price tag, creating an ecosystem whose user base skews toward higher disposable income brackets in Tier-1 markets (US, Western Europe, Japan). Eiosys
- Spending Culture: iOS users show a significantly higher willingness to pay for digital goods, software subscriptions, and premium features, whereas Android users generally prefer ad-supported free software. Eiosys
B. Monetization Models & In-App Purchases (IAPs)
- Subscriptions over Ad Revenue: iOS developers rely heavily on high-margin models like recurring subscriptions and direct In-App Purchases (IAP).
- Frictionless Payments: Apple’s unified payment ecosystem, strict biometric security (Face ID/Touch ID), and pre-linked credit cards create lower friction at checkout compared to diverse Android payment gateways.
C. Fragmentation vs. Optimization
- Hardware Standardization: Developers target a limited number of active iPhone models and screen sizes, making design, QA, and testing faster and cheaper.
- Android Fragmentation: Android operates on thousands of distinct devices across varying hardware specs, forcing developers to spend more resources optimizing for lower-tier hardware rather than refining revenue funnels.
D. App Store Governance & Quality Curation
- Strict Review Guidelines: Apple enforces rigorous review guidelines before approving apps. This reduces spam and low-quality apps, increasing consumer trust to make paid purchases. Bigabid+ 1
- Sideloading & Piracy Concerns: Android allows easy sideloading of third-party APKs, leading to higher rates of app piracy and revenue leakage in developing markets. Eiosys
2. Key Statistical Insights
| Metric | Apple App Store | Google Play Store |
|---|---|---|
| Global OS Market Share | ~28–30% | ~70–72% |
| Total Global Downloads | Lower (~30%) | Higher (~70%) |
| Monetization Preference | Subscriptions & IAP | Ad-supported & Freemium |
| Consumer Spending Share | ~65% | ~35% |
3. Conclusion for Developers & Businesses
While Google Play is superior for mass reach, market penetration, and total download volume, iOS remains the primary launch target for monetization-focused apps (SaaS, productivity tools, games, and premium utility services). Most multi-platform SaaS products adopt a dual approach: monetizing heavily on iOS while using Android for organic distribution and top-of-funnel user acquisition.
Gummicube
🔗 Research & Benchmark References
For further reading on empirical data and industry reports, refer to these industry sources:
- Business of Apps – App Data & Revenue Report: App Data Report: Revenue & Industry Statistics Business of Apps
- ResearchGate Academic Study: Revenue models, in-app purchase, and app performance: Evidence from Apple’s App Store and Google Play ResearchGate
- Washington University Law Review: Apple and Google App Stores v. Developers Legal & Revenue Analysis